Style guide for coursework
Please take note of the following guidelines when writing your report.
Text
- Academic papers are factual reports that describe scientific methods, approaches, research, or experiments. They are never emotionally charged or subjective narratives (i.e., not phrases like "I have," "In my opinion," "It was exciting," etc.). Colloquialisms and the first person ("I have," "we," "us," etc.) should be avoided. A factual and objective style is recommended.
- Passive constructions can help avoid personal language, but overuse can sound simplistic and should therefore be used judiciously.
- Sentences should be short and concise. Longer subordinate clauses should be avoided.
- General facts and results are presented in the present tense. The past tense is used for statements about the experimental procedure or the development of the project that are only temporarily valid.
- Every new and unfamiliar term should be briefly explained the first time it is used. Likewise, every unfamiliar abbreviation should be written out in full, with a brief explanation if necessary, the first time it is used.
- At least one non-breaking space should be inserted between numbers and their units (in Word: Ctrl+Shift+Space) to prevent line breaks. A narrow non-breaking space is typographically correct: "3cm". However, this requires a little more effort when typing: Wikipedia
- Pay attention to correct comma placement: www.duden.de/sprachwissen/rechtschreibregeln/komma
- In German, compound nouns are written without a hyphen. A hyphen can be useful if it improves readability. This is the case, for example, when foreign words are combined with German words: Software-Ergonomie instead of Softwareergonomie avoids the "ee" at the word boundary.
- When using foreign (mostly English) technical terms, several options exist. The author has some freedom of choice but must use their chosen convention consistently. The chair's recommendations are as follows:
- The term is common in German and listed in the Duden dictionary. In this case, it should be used.
- The term is common in the field. It is defined upon first use or in a glossary. As a fixed term, it is capitalized (but without a hyphen in word combinations from English): "Some researchers understand usability as a subset of user experience." However, if German and foreign terms are combined, a hyphen is used: "Usability questionnaire," "User experience criteria."
- The term is moderately familiar in the field, but cannot be assumed to be a standard term, and there is no German translation that accurately reflects its meaning: The foreign-language term is used in its original spelling (usually lowercase) in the German text. To distinguish it, it is italicized: "Norman (1989) understands affordance as the property of an object to indicate possibilities of use." A detailed explanation of the term is required.
- For non-native speakers, it is strongly recommended that the text be reviewed by a native speaker before submission.
Illustrations and diagrams
- Every figure needs a connection to the text. It should be explicitly named: "This principle is illustrated in Figure 3."
- If possible, use "Figure 3" as a cross-reference in the text. This allows the reader to click on it and prevents line breaks.
- Every figure should be understandable solely from the image and its caption (i.e., even without the description in the text).
- Use consistent color and shape coding throughout the entire document.
- Ensure that all axes are labeled and all units used are specified. Symbols must be explained in a legend. All types of symbols or (color) codes in a figure must convey information, and their relationship to this information must be explained. In a scientific paper, there are no unexplained or ornamental color/shape/text codes.
- Include all relevant information, such as details of statistical analyses, in the figure (or the caption). Examples: significance level, standard deviation, etc.
- For each reported mean, one of the following error bars must be provided: standard deviation, standard error, 95% confidence interval, or range. (Specify the type in the chart label or legend!)
- Chart types other than bar charts are also possible and may be appropriate. Even then, all information necessary for interpreting the chart must be included. For example, in a box plot, the legend explains which values each bar and data point represents.
- Lines connecting data points suggest trends, interpolability, or relationships. Use them only if these relationships exist between the data points! For example, this is not the case between the means of two different questions in a questionnaire!
- Scales that do not start at zero should be avoided.
- This does not apply if scales have defined limits. For example, a Likert scale in a questionnaire ranges from -3 to 3.
- If a scale starting at 0 is not feasible due to space constraints, or if differences in data points would then no longer be discernible, the x-axis should not be at a higher y-value, but rather at 0, and the y-axis (and any bars) should be displayed with a broken line. However, all data points/bar ends must be above the broken y-axis! If the values are very far apart, a multi-panel chart is recommended.
General guidelines for diagram creation:
- The y-axis starts at zero and is evenly spaced.
- The x-axis is also evenly spaced. The range of x-values shown in the diagram is chosen to be as relevant as possible.
- The measurements represented by the symbols are proportional to the numbers they represent.
- All choices regarding axis ranges, units, etc., are as objective as possible and are logically aligned with the question at hand.
- Use appropriate font sizes: 12 pt or 14 pt for text in diagrams, and 18 pt for headings, for example, in bold. Use a sans-serif font for diagrams.
- When using color, ensure that the text and background colors have sufficient contrast: light text on a dark background and vice versa.
- Make sure that printouts are legible and understandable even in black and white! Even in a black and white printout, unrelated elements must be identifiable through contrast or hatching.
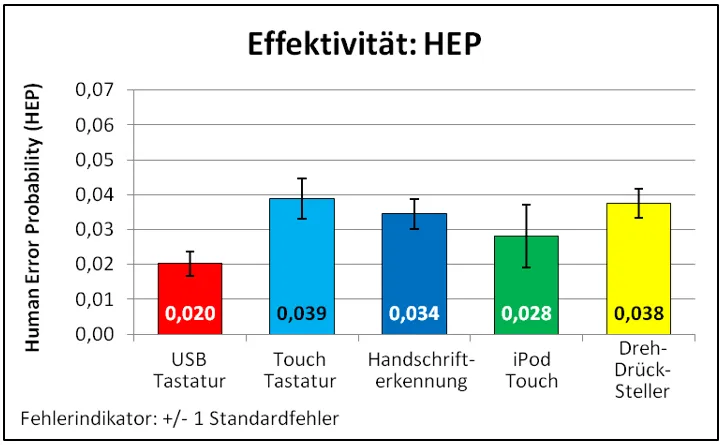
An example of how to present a statistical analysis:
Further information on the scientific presentation of illustrations can be found in the APA Manual (2010) and in Field (2013).
Results of statistical analysis
Use a period instead of a comma to indicate decimal places. Decimal places should also be consistent; ideally, round your results to two decimal places. Descriptive data (e.g., means) can be presented in tables and do not need to be repeated in the text (but the tables must be referenced). If a variable cannot take a value greater than 1, the leading zero can be omitted, e.g., r = .30. p-values should be reported exactly: p = .031. This does not apply if the p-value is less than .001; it is reported as p < .001. Population parameters (e.g., µ) are expressed using Greek symbols and are not italicized. Sample parameters and all other statistical symbols are expressed using Latin symbols and are always italicized, e.g., r, t.
Statistical tests are reported in the text as follows:
- Chi Quadrat (df, Chi-Quadrat-Wert, p-value): χ2(2) = 10.42, p < .01
- t-test (df, t-Wert, p-value): t(39) = 4.30, p = .020
- ANOVA (df, F-Wert, p-value): F(2,39) = 4.30, p = .031
- Regression (Betas, standardisierte Betas, r², wenn nötig ΔR²): β = .41; p < .01; R²= .17
Regressions are best reported in a table:
- Logistic regression (Beta, Wald-Test, Nagelkerkes R²): β = −.12; p = .301 ; Wald = .31; Nagelkerkes R² = .01
The logistic regression is also best reported in a table.
| UV | AV | β | Wald | Nagelkerkes R² |
|---|---|---|---|---|
| Blink frequency | reaction | 1.33 | 8.33** | .34 |
| Distance from the object | reaction | −1.00 | 64.00 | .08 |
Examples of reporting a t-test in running text:
- "A significant difference was found between the two operating concepts (t(29) = 2.33, p = .040)."
- "The t-test yielded a significant result with t(29) = 2.33 (p = .040)."
It is best to discuss the reporting of effect sizes individually with your supervisor.
Literature
APA Manual (Publication manual of the American Psychological Association) (6th ed.) (2010). Washington, DC: American Psychological Association.
Field, A. (2013). Discovering statistics using IBM SPSS statistics (MobileStudy, 4th edition). Los Angeles, London, New Delhi: Sage.